Operations
All of our solutions are very tightly engineered and completely under our control. We ship all of our software via RPM; and every 30 minutes systems run their Chef/orchestration.
Monitoring
Monitoring Dashboard
We utilise the Grafana ecosystem to monitor all of our customer infrastructure, with most of our Products having dedicated Dashboards.
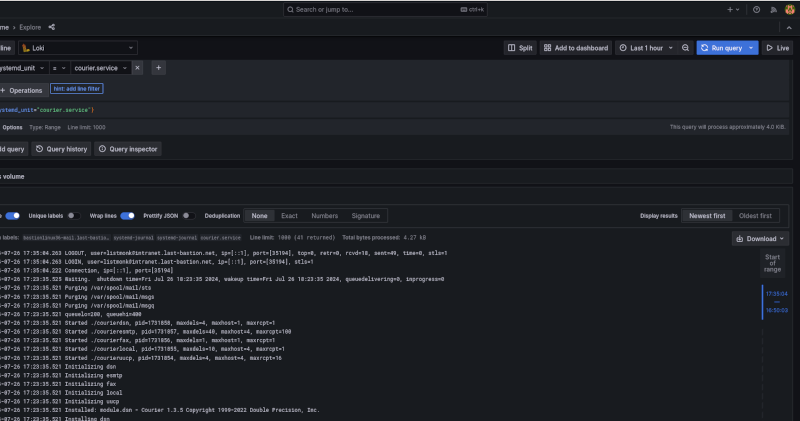
Logging Dashboard
All system logs are remotely shipped into our Loki; where we can run all sorts of scripted and adhoc queries to get to the root cause of an issue.
We ship a comprehensive set of alerts for which our AlertManager does real-time management.
Incidents
All of our systems are Infrastructure as Code; so when there is an incident, a software development process is undertaken to get to resolution; this normally involves an Inspec control being written to prove the issue (and the resolution); then a new software release via our RPM/Entitlements (or a new version of a Chef artifact).